Migrate an existing visualization extension to nebula.js framework
This tutorial walks you through migrating a Qlik Sense visualization extension from the AngularJS-based Extension API to nebula.js, the framework-agnostic visualization SDK.
The example extension is a simple D3.js bar chart. The tutorial uses this small example to make one point clear: the surrounding scaffolding changes between the two frameworks, but the rendering code itself stays the same. You move the same D3.js function from one framework to the other without rewriting it.
What you’ll learn
By the end of this tutorial, you’ll have:
- Compared the complete source code of an Extension API-based bar chart with its nebula.js equivalent
- Scaffolded a nebula.js extension project using the CLI
- Ported the hypercube definition and property panel configuration to nebula.js
- Reused the existing D3.js rendering function unchanged in the migrated extension
Prerequisites
Before you start, ensure you have access to the following:
- Node.js (version 24 or newer)
- A terminal
- A modern web browser (for example, Google Chrome)
- A text editor or IDE (for example, Visual Studio Code)
The extension you’re migrating
The following extension renders one dimension and one measure as a horizontal D3.js bar chart. It’s built
with the Extension API: a single JavaScript file, loaded with RequireJS, that defines the property panel
and renders the chart in a paint() method.
Extension API source: bar-chart.js
define(['jquery', 'd3'], function ($, d3) {  function drawBarChart(element, layout) {    const rows = layout.qHyperCube.qDataPages[0].qMatrix;    const data = rows.map((row) => ({ label: row[0].qText, value: row[1].qNum }));
    const width = 400;    const barHeight = 24;
    const x = d3.scaleLinear()      .domain([0, d3.max(data, (d) => d.value)])      .range([0, width]);
    d3.select(element).selectAll('*').remove();
    const svg = d3.select(element)      .append('svg')      .attr('width', width)      .attr('height', barHeight * data.length);
    const row = svg.selectAll('g')      .data(data)      .enter()      .append('g')      .attr('transform', (d, i) => `translate(0, ${i * barHeight})`);
    row.append('rect')      .attr('width', (d) => x(d.value))      .attr('height', barHeight - 2)      .attr('fill', 'steelblue');
    row.append('text')      .attr('x', 6)      .attr('y', barHeight / 2)      .attr('dy', '0.35em')      .attr('fill', 'white')      .text((d) => d.label);  }
  return {    initialProperties: {      qHyperCubeDef: {        qDimensions: [],        qMeasures: [],        qInitialDataFetch: [{ qWidth: 2, qHeight: 100 }],      },    },    definition: {      type: 'items',      component: 'accordion',      items: {        dimensions: { uses: 'dimensions', min: 1, max: 1 },        measures: { uses: 'measures', min: 1, max: 1 },        sorting: { uses: 'sorting' },        settings: { uses: 'settings' },      },    },    paint($element, layout) {      drawBarChart($element[0], layout);    },  };});
Note the three things that a nebula.js migration needs to account for:
initialPropertiesdefines the default hypercube.definitionconfigures the property panel.paint($element, layout)renders the chart into a jQuery-wrapped DOM element every time the layout changes.
The drawBarChart() function itself doesn’t depend on the Extension API: it only needs a DOM element and
a layout object. That’s the function you’ll carry over to nebula.js unchanged.
Create a project
Run the following command to create a new nebula.js extension project called bar-chart:
npx @nebula.js/cli create bar-chart --picasso none --pkgm npmThe --picasso none option tells the command to not create a picasso visualization template. Other
options are minimal and barchart. The --pkgm npm option makes the command use npm; without it, the
CLI uses yarn if it’s installed locally, and falls back to npm otherwise.
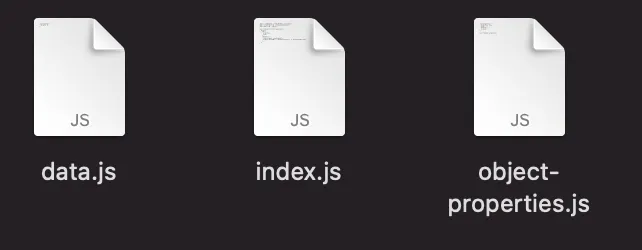
The command scaffolds a project with the following files:
Start the development server
Run the following commands to start the development server:
cd bar-chartnpm run startThe command starts a local development server and opens http://localhost:8000 in your browser.
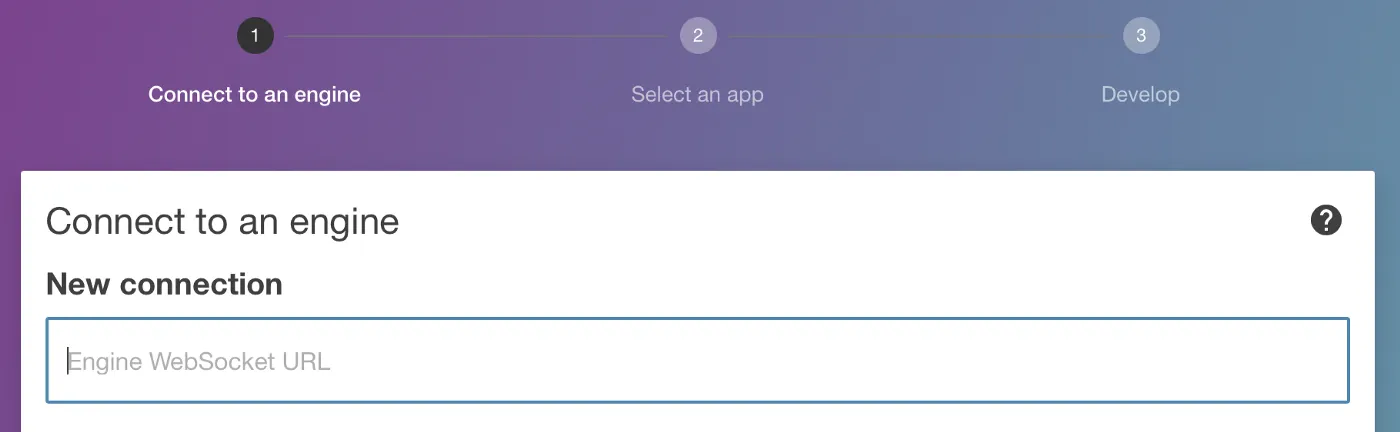
Connect to your Qlik Cloud tenant using the WebSocket protocol, then select an app to test the visualization against in the developer UI.
Configure the data structure
nebula.js splits the properties and property panel definition that used to live in initialProperties and
definition across three files: src/object-properties.js, src/ext.js, and src/data.js.
Replace the content of src/object-properties.js with the following, matching the initialProperties
from the Extension API version:
const properties = {  qHyperCubeDef: {    qInitialDataFetch: [{ qWidth: 2, qHeight: 100 }],  },};
export default properties;
Replace the content of src/ext.js with the following:
export default function ext(/* galaxy */) { return { definition: { type: 'items', component: 'accordion', items: { data: { uses: 'data' }, sorting: { uses: 'sorting' }, settings: { uses: 'settings' }, }, }, support: { snapshot: false, export: true, sharing: false, exportData: true, viewData: true, }, };}Note the one meaningful difference from the Extension API version: nebula.js replaces the separate
dimensions: { uses: 'dimensions' } and measures: { uses: 'measures' } accordion items with a single
data: { uses: 'data' } item. The dimension and measure pickers it renders, and their min/max limits, are
now driven by the target you define in src/data.js instead.
galaxy contains environment-specific inputs. For more information, see Load an extension into Qlik
Sense.
Add /qHyperCubeDef as a data target in src/data.js:
export default { targets: [ { path: '/qHyperCubeDef', dimensions: { min: 1, max: 1 }, measures: { min: 1, max: 1 }, }, ],};Reuse the rendering function unchanged
Add D3.js as a dependency:
npm install d3 --saveCreate src/viz.js and paste in the exact same drawBarChart() function from the Extension API version,
without any changes:
import * as d3 from 'd3';
export default function drawBarChart(element, layout) {  const rows = layout.qHyperCube.qDataPages[0].qMatrix;  const data = rows.map((row) => ({ label: row[0].qText, value: row[1].qNum }));
  const width = 400;  const barHeight = 24;
  const x = d3.scaleLinear()    .domain([0, d3.max(data, (d) => d.value)])    .range([0, width]);
  d3.select(element).selectAll('*').remove();
  const svg = d3.select(element)    .append('svg')    .attr('width', width)    .attr('height', barHeight * data.length);
  const row = svg.selectAll('g')    .data(data)    .enter()    .append('g')    .attr('transform', (d, i) => `translate(0, ${i * barHeight})`);
  row.append('rect')    .attr('width', (d) => x(d.value))    .attr('height', barHeight - 2)    .attr('fill', 'steelblue');
  row.append('text')    .attr('x', 6)    .attr('y', barHeight / 2)    .attr('dy', '0.35em')    .attr('fill', 'white')    .text((d) => d.label);}
This confirms the point of the tutorial: the D3.js code that draws the chart didn’t change. Only the
function signature moved from paint($element, layout) to a plain exported function that takes a DOM
element and a layout.
Wire up the rendering logic
Replace the content of src/index.js with the following:
import { useElement, useLayout, useEffect } from '@nebula.js/stardust';import properties from './object-properties';import data from './data';import ext from './ext';import drawBarChart from './viz';
export default function supernova(galaxy) {  return {    qae: {      properties,      data,    },    ext: ext(galaxy),    component() {      const element = useElement();      const layout = useLayout();
      useEffect(() => {        if (layout.qSelectionInfo.qInSelections) {          return;        }        drawBarChart(element, layout);      }, [element, layout]);    },  };}
Compare this to the Extension API version:
useElement()replaces the jQuery-wrapped$elementparameter passed topaint().useLayout()replaces thelayoutparameter passed topaint().useEffect()re-runsdrawBarChart()wheneverelementorlayoutchange, replacing the automatic call nebula.js’s runtime makes topaint().
Test the extension locally
- Run the following command to start the development server:
npm run start-
Add one dimension and one measure using the property panel on the right.
-
Verify that the chart renders as a horizontal bar chart, matching the Extension API version.
Build and upload the extension
With the extension working locally, build and package it for deployment to your Qlik Cloud tenant.
- Generate a bundle into the
/distfolder:
npm run build- Generate the required Qlik Sense metadata files:
npm run senseThis command creates a /bar-chart-ext folder containing the .qext manifest and bundled JavaScript.
- Zip the
/bar-chart-extfolder and upload it to your Qlik Cloud tenant. For more information, see Uploading and managing visualization extensions on Qlik Help.
To upload an extension to your Qlik Cloud tenant, you must have one of the following roles:
Tenant AdminroleAnalytics Adminrole- Custom role with the Manage extensions (
admin.extensions) permission set to Allowed assigned
Summary
You’ve migrated a D3.js visualization extension from the Extension API to nebula.js. The key takeaway:
- Scaffolding differs. Properties, property panel configuration, and rendering now live in separate
files (
object-properties.js,ext.js,data.js,index.js) instead of one Extension API file. - Rendering doesn’t. The
drawBarChart()function moved into its own module without a single line changed. Any D3.js (or other library) rendering code you already have carries over the same way. - Hooks replace the
paint()lifecycle.useElement()anduseLayout()replace the$elementandlayoutparameters, anduseEffect()replaces the automatic call topaint().
Next steps
Now that you’ve migrated a small extension to nebula.js, you can continue by exploring these resources: