Offline analytics snapshot embedding with qlik-embed and OAuth M2M
Overview
This tutorial shows how to configure and run a web app that fetches and displays analytics snapshots using qlik-embed,
the analytics/snapshot UI, and OAuth machine-to-machine (M2M) authentication.
- This tutorial is based on version v1.0.0 of the project repository.
- This project is not production-ready. It is intended for learning and evaluating Qlik Cloud API access and artifact handling with a simple Node.js backend.
- For a production app:
- Review the Machine-to-Machine OAuth2 client applications documentation.
- Never expose client secrets in frontend code.
- Use HTTPS rather than HTTP.
This project leverages the Sharing tasks API and OAuth M2M to securely list chart-monitoring tasks and download their snapshot artifacts. It demonstrates:
- Listing Qlik Sense chart-monitoring tasks, using the Sharing tasks API.
- Downloading and saving snapshot artifacts (images, JSON) to the backend.
- Serving minimal snapshot metadata to the frontend for display.
- Keeping monitoring charts active to prevent expiration by accessing them before they reach 90 days of inactivity.
Monitoring charts are automatically disabled and no longer updated if they are not viewed or accessed for 90 consecutive days. To keep your monitoring charts active and continuously refreshed, the project regularly fetches snapshots from the Sharing tasks API. This automated refresh prevents deactivation and ensures your charts remain available.
How the web app works
The web app operates in two modes:
-
Fresh snapshot retrieval: When you click Refresh snapshots from Qlik Cloud, the backend authenticates using OAuth M2M, retrieves chart-monitoring tasks, downloads the latest snapshot artifacts, and saves them in
public/snapshots/. These are then served to users without requiring authentication. -
Local snapshot serving: Previously downloaded snapshots are served from local storage, enabling fast loading, offline access, and reduced API calls to Qlik Cloud.
Snapshots can be displayed in two modes:
- Image mode: Static PNG images for fast loading.
- Interactive mode: Full qlik-embed snapshots with limited interactivity.
What you’ll learn
By the end of this step-by-step tutorial, you’ll have:
- Fetched and displayed analytics snapshots in your web app.
- Configured OAuth M2M authentication for secure backend API access.
- Deployed a working example of a Node.js backend serving analytics snapshots.
Prerequisites
- Node.js version 22 or higher.
- A Qlik Cloud tenant with chart-monitoring tasks and available analytics snapshots.
- An OAuth M2M client with scope
user_defaultand allowed origins set tohttp://localhost:3000.
Step 1: Set up your local project
In this step, you’ll set up a local development environment by cloning the GitHub repository or downloading the project files.
Method 1: Create a repository from the template
- Go to GitHub repository for this template.
- Click Use this template.
- Follow the instructions to create a new repository from this template.
- Clone your newly created repository:
Terminal window git clone <your-repo-url>
Method 2: Download and extract the project files
Alternatively, you can download and extract the project files.
- On the project’s GitHub page, click Code.
- Select Download ZIP.
- Extract the content of the ZIP file in the folder of your choice.
Step 2: Configure environment variables
In this step, you’ll configure environment variables to securely store sensitive information and connect to the right resources.
- Rename the
template.envfile to.env. - Edit the
.envfile with values that match your Qlik Cloud deployment:
QLIK_M2M_CLIENT_IDandQLIK_M2M_CLIENT_SECRET: Specify the credentials obtained when you created the OAuth M2M client in the Administration activity center.QLIK_TENANT_URL: Specify the hostname of your Qlik Cloud tenant, such asz29kgagw312sl0g.eu.qlikcloud.com.
Keep these secrets safe as they provide wide access to your tenant.
Step 3: Install dependencies and run the app
Now that the project is configured, you can install the required dependencies and run the app locally to view the embedded analytics snapshots.
-
Open a terminal window and navigate to the folder containing the project files you cloned or extracted.
Terminal window cd <project-folder> -
Install the project dependencies.
Terminal window npm install -
Start the server.
Terminal window npm start -
Open
http://localhost:3000in your browser.
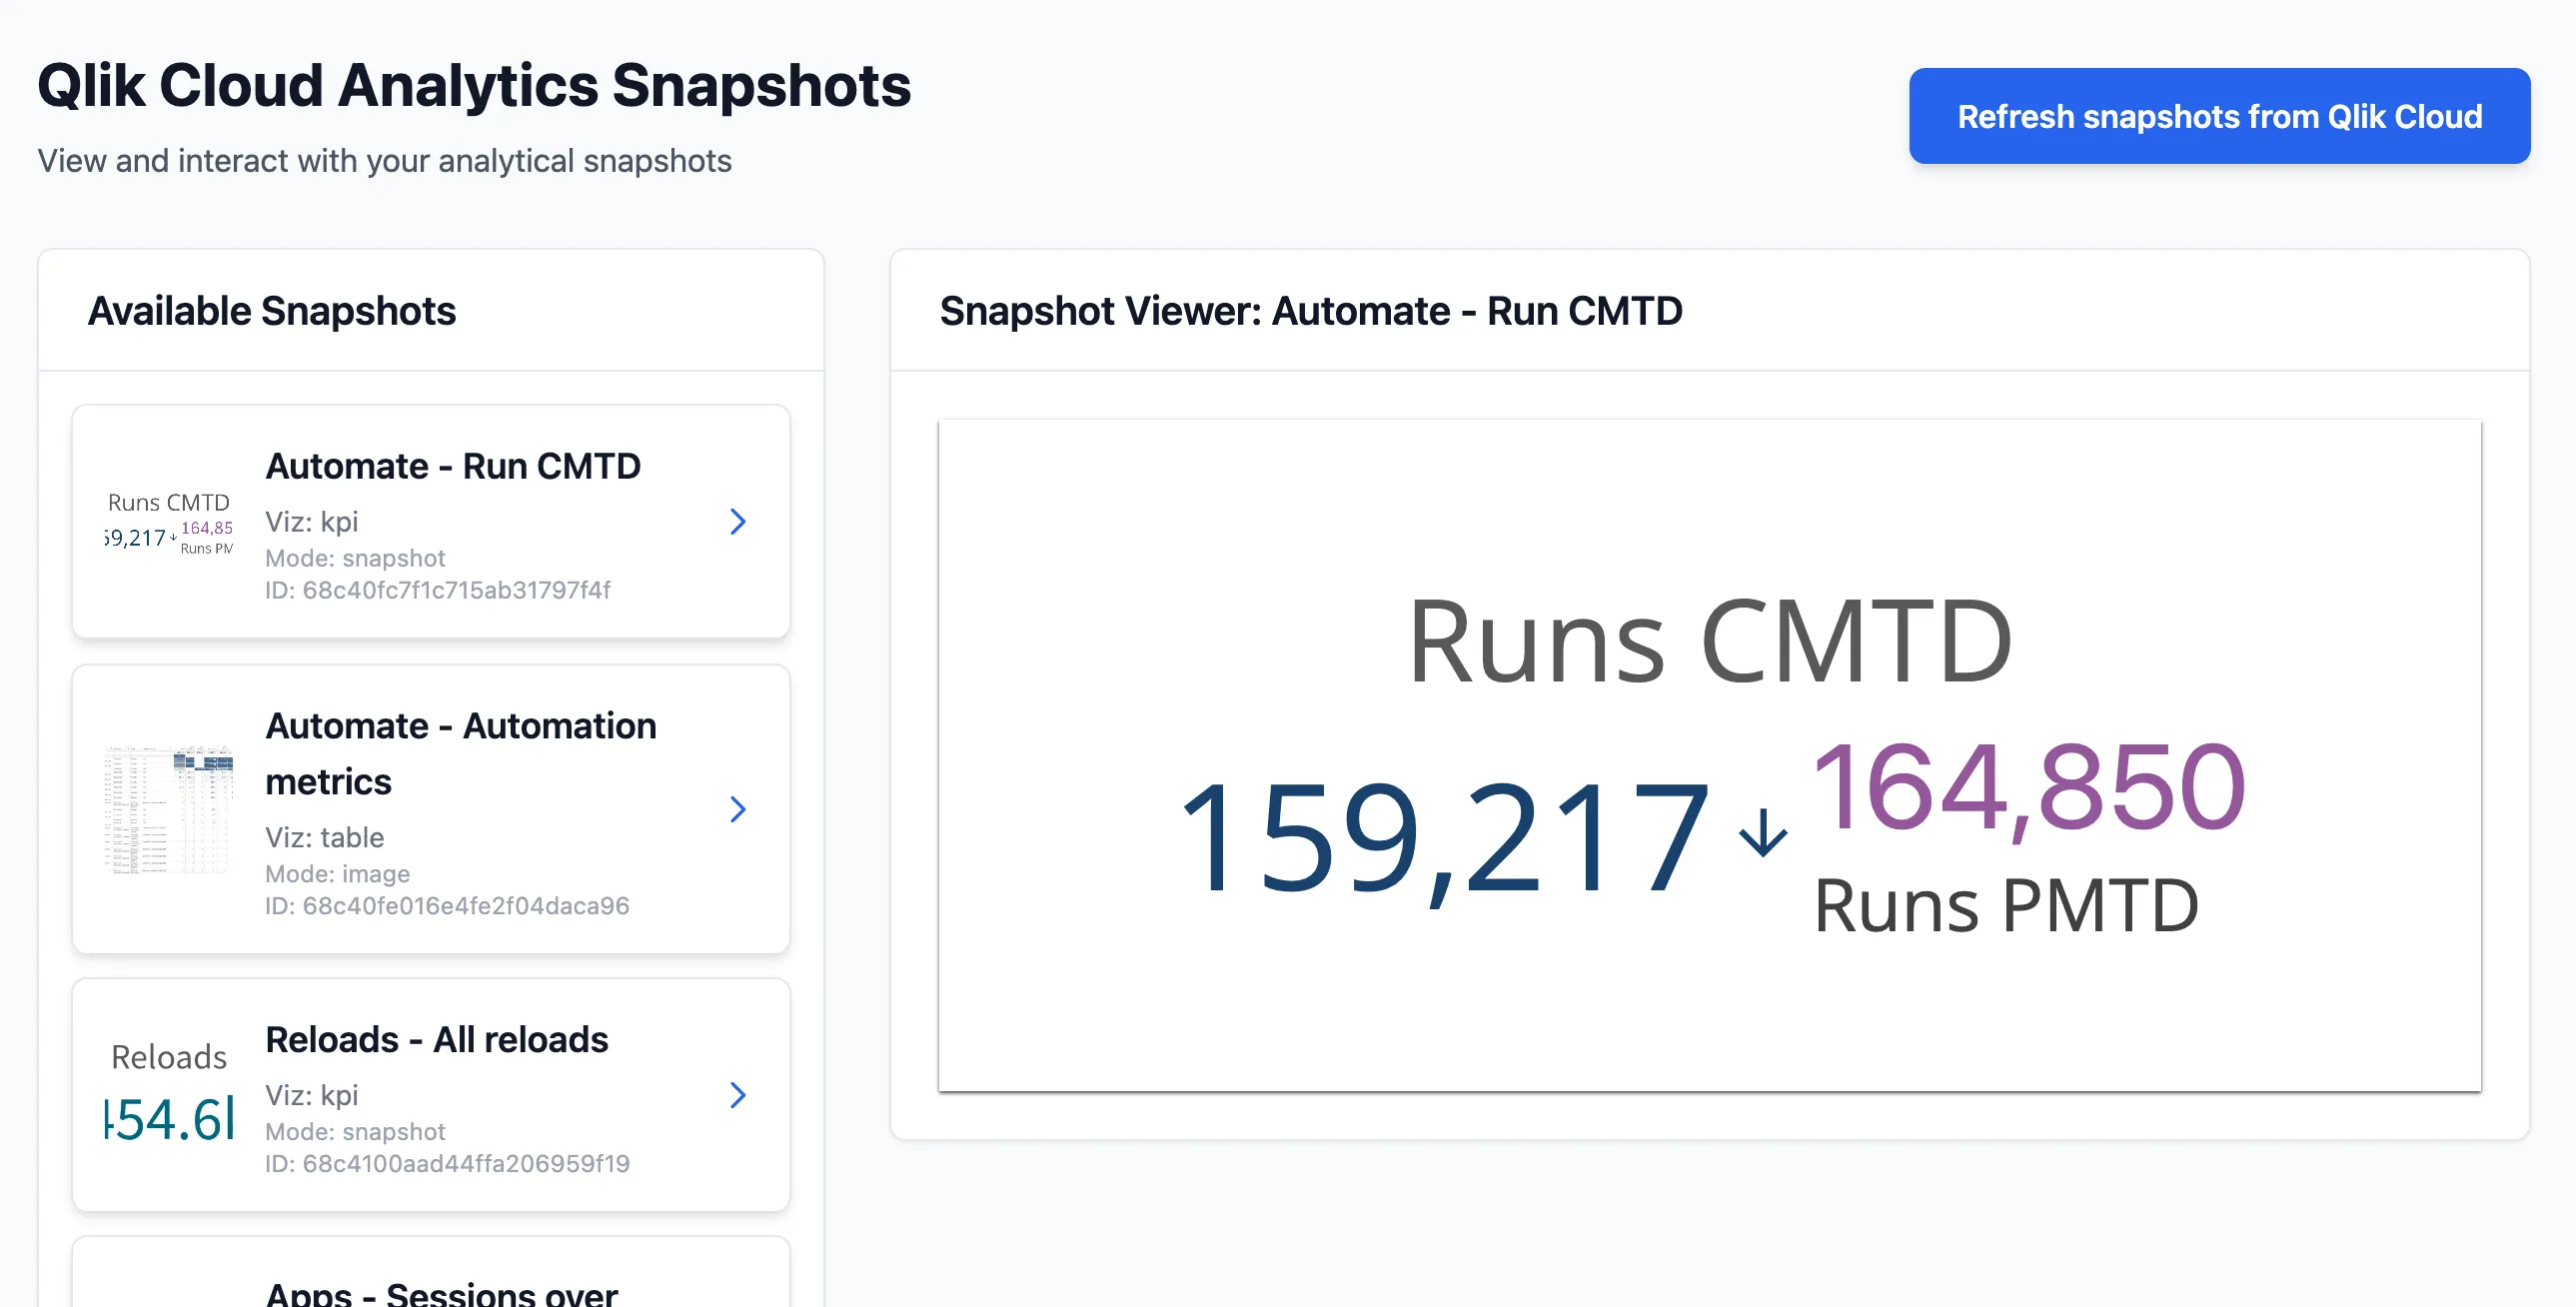
You should see your web app running locally, displaying available analytics snapshots from your Qlik Cloud tenant. Selecting a snapshot will display its images and metadata.
Troubleshooting
- If the app does not load, verify the environment variable values configured in step 2 and review any error messages in the terminal.
- If you get authorization errors, verify the scopes and credentials for your OAuth M2M client.
- Ensure your Qlik Cloud tenant has chart-monitoring tasks with available analytics snapshots.
Next steps
You now have a working web application that lets you retrieve, store, and display analytics snapshots offline in your
browser using qlik-embed and the analytics/snapshot UI.
To enhance and extend your solution, consider the following next steps:
- Add more analytics snapshot details or visualizations to the frontend.
- Deploy your backend and frontend behind HTTPS and test end-to-end.